After uploading the dataset file, use the “Spec Upload” tab to access the specification file upload screen. Upload a specification file (either .docx and .xlsx format) via the Browse… button or by dragging and dropping the file in the space next to it.
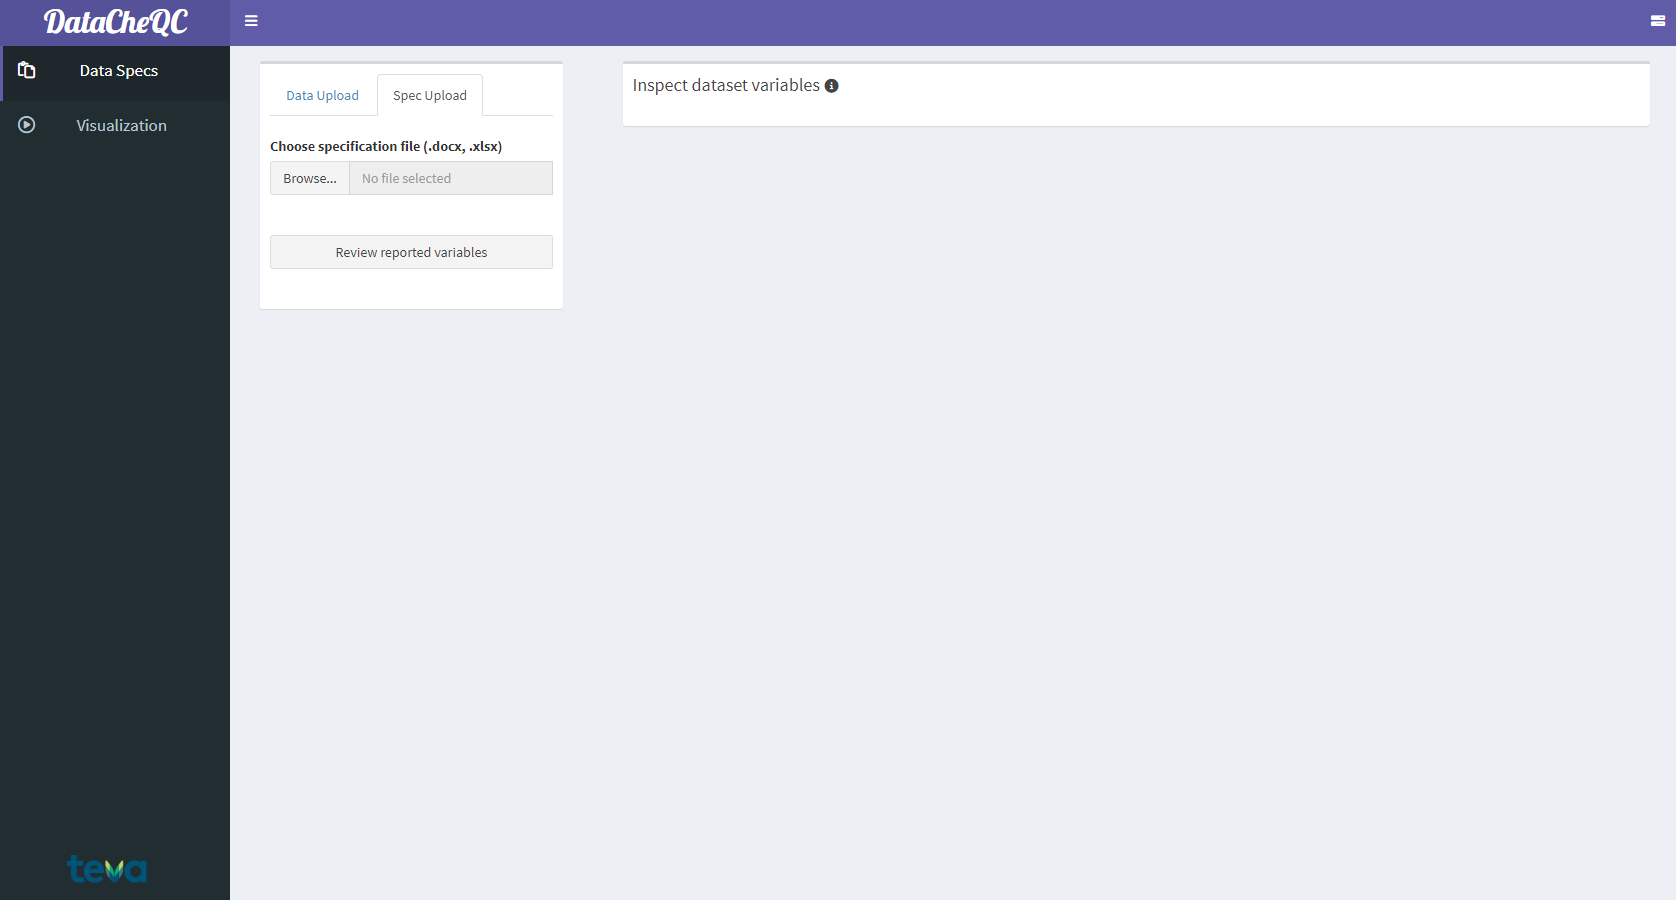
The Specification File Upload Screen
After the specification file has been uploaded, multiple options will be revealed:
“Switch to event table”: toggle between viewing the specification General and Event Tables, which cover dataset columns and events/observations respectively.
“Filter optional variables / variables requiring input from the pharmacometrician”: Filter out variables according to these criteria (if those columns are included in the specification file).1
To the right, the selection bar allows the user to select multiple items for review, which will reveal two tables:
Data summary table (Top)
Contains a description of each variable’s unique values and their amount, the type of data (numeric, character, etc.) and the number of NA or blank values
Variables that have multiple missing values will be marked in yellow
Variables that have conflicting information (e.g., different units for the same observation) will be marked in red
Specification for the chosen variables (Bottom)
Contains the parts of the specification file that correspond to the selected items and includes their type, label, typical values and other information
Allows for comparison between the data summary and the specification on a per-item basis
If a chosen item from the specification file is not present in the data, it will be italiczed and colored red
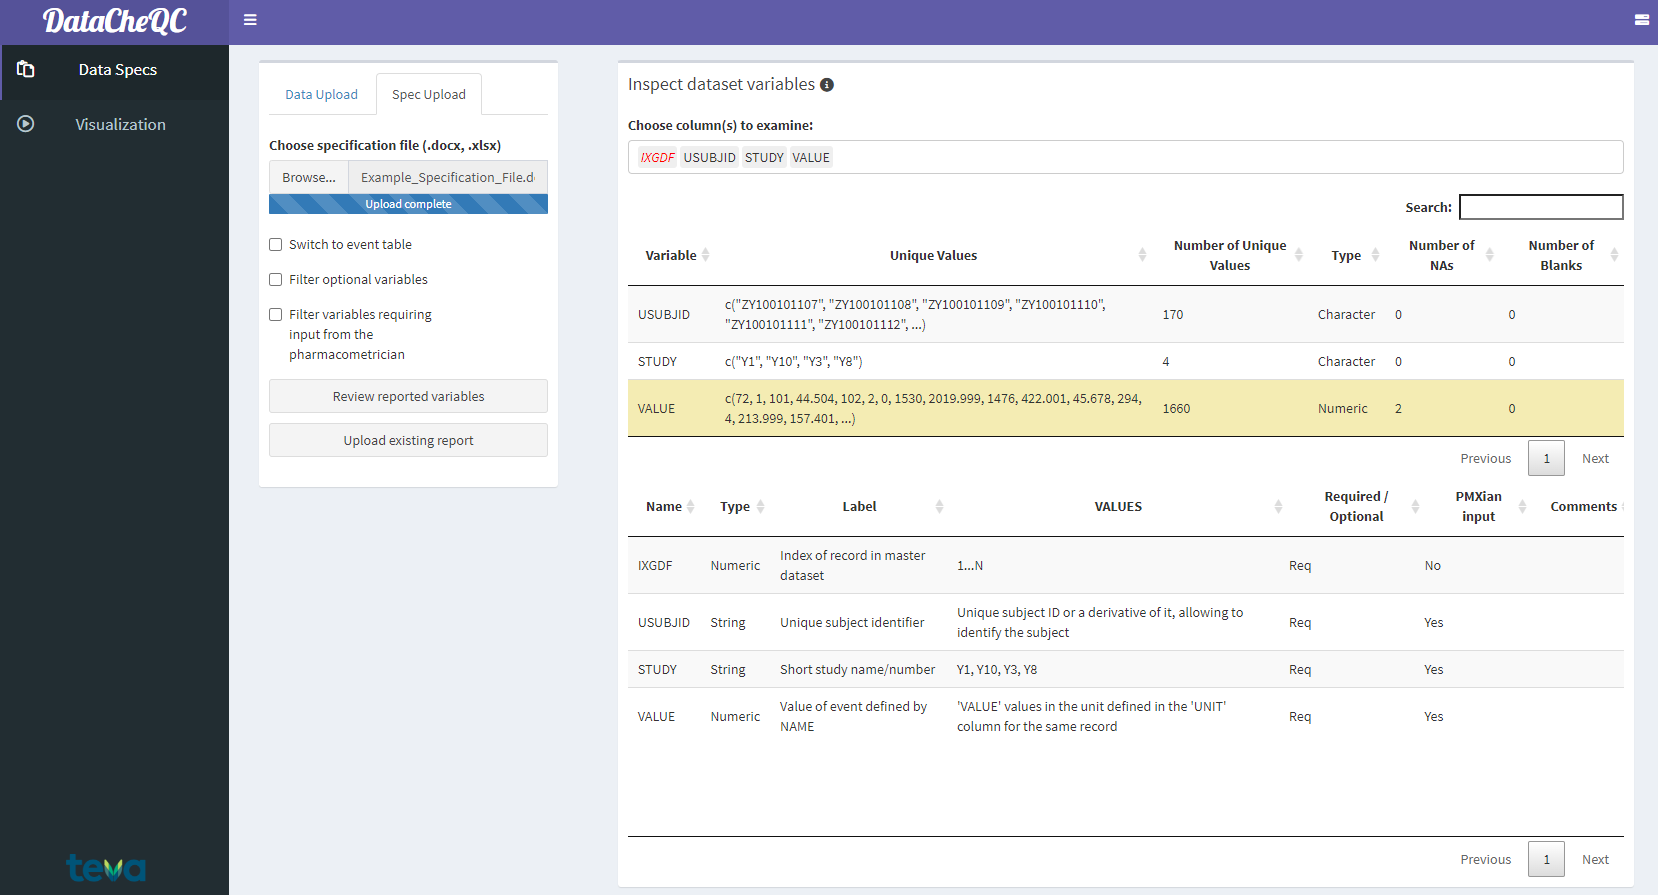
Data-Specification Comparison Tables
If one or more items look to be defined incorrectly or have unexpected missing values, the user can look deeper into them by clicking on their corresponding row in the top table. This reveals several options:
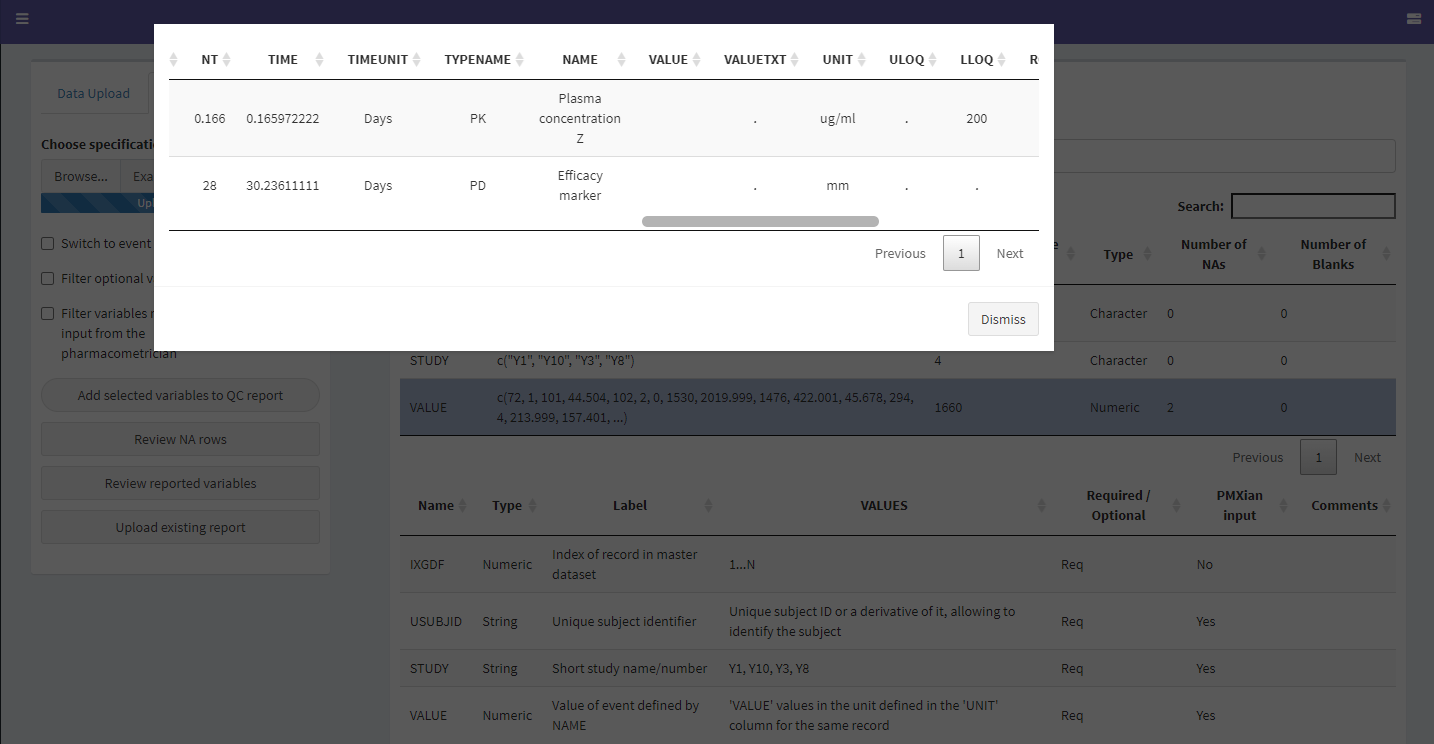
The Review NA Values Screen
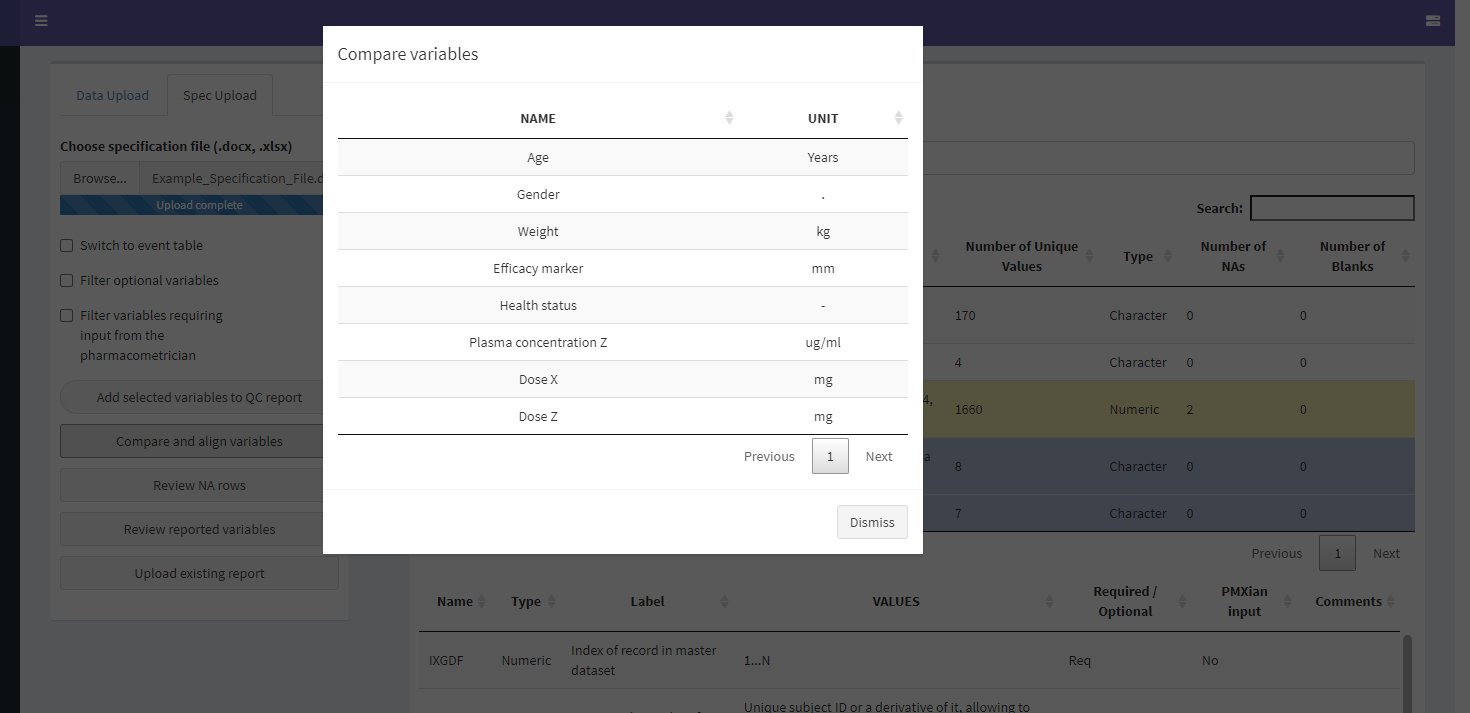
The Compare and Align Variables Screen
After clicking on “Review reported variables”, the QC report review screen will be shown. Users must enter their name at the top, and then edit the table of reported items by double clicking the corresponding cell and writing in any conclusions drawn from the comparison process.
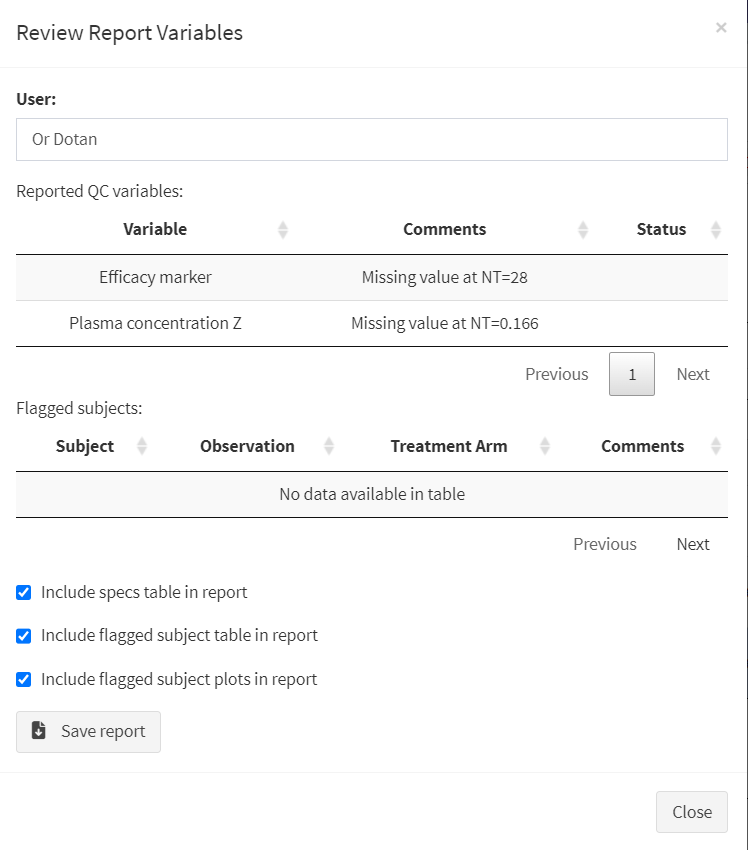
The QC Report Review Screen
After completing this part of the QC report, users can move on to conducting visual checks and reviewing summary data.